
Speed read
Three claims have followed investors through 2026. The 60/40 portfolio is dead because shares and bonds now fall together. Markets have never been this concentrated, so you must diversify away from the giants. And diversification has stopped working. Each one starts from a true observation, and the trouble lies in the cure that comes attached. Shares and bonds did fall together in 2022 and again this year, yet today's bonds pay far more interest to cushion the fall. The 10 largest US companies are close to 40% of their market, much as they were in 1964, and research covering almost 90 years found that cutting back when the market was concentrated left investors poorer. Diversification spent a decade unrewarded and kept doing its job. It is something a portfolio is designed to deliver, and any step away from the market is an active decision that must earn its place.
Key takeaways
- Bond Shares and bonds tend to fall together when inflation is the shock and move apart when growth stalls. That pattern has held for decades, and it is why 2022 and 2026 looked alike. The difference this time is the interest bonds pay, about 5.2% on 10-year US government bonds today against 1.5% at the end of 2021.
- High concentration describes how the market is made up today. Research covering almost 90 years of US data found it told investors little about how risky the market would be, and the popular cures swap one concentration for large bets on sectors and countries.
- Diversification is built so that your outcome doesn't depend on one winner. It will trail whatever is leading at the time, and the leader has changed more often than a 10-year average suggests.
Every myth starts with something true
Good portfolio construction starts from one idea. Diversification is an objective you design for, and every step away from the market is an active decision that has to justify itself.
Three claims have tested that idea this year. You may have heard them over dinner as often as in the financial press. Each begins with an observation we agree with. Shares and bonds have fallen together. A handful of US companies make up a large slice of the world's stock markets. And a broadly spread portfolio has trailed the biggest US names for most of a decade.
The snake oil is in the conclusion. Each claim arrives with a remedy, and each remedy is a bet that someone has to get right.
"The 60/40 is dead"
The case runs like this. A portfolio of 60% shares and 40% bonds relies on bonds rising when shares fall. In 2022 both fell hard, and they have wobbled together again this year. So, the argument goes, bonds no longer protect you and you need private credit, alternatives or structured products instead.
Diversification has never required assets to move in opposite directions. Two investments spread your risk whenever they move less than perfectly in step, which in the language of statistics means a correlation below 1. And the link between shares and bonds has been positive for long stretches before. Researchers at AQR, writing in the Journal of Portfolio Management in 2023, found it was consistently negative for the first two decades of this century and positive through the 1970s, 80s and 90s.
The kind of shock decides the direction. When the news is about inflation, shares and bonds tend to move the same way. When it is about growth, they tend to move apart. AQR's simple model of this explains around 70% of the long-term variation in the US relationship. An inflation shock in 2022, and another this year as conflict in the Middle East pushed up energy prices, produced what that history would lead you to expect.
Growth scares look different. As the dotcom bubble burst, from August 2000 to September 2002, 10-year US government bonds returned 29% in dollars, according to J.P. Morgan Asset Management. Through the financial crisis, from October 2007 to February 2009, they returned 20%. Those are the moments a balanced portfolio holds bonds for.
The bigger change today is the starting point. At the end of 2021, the 10-year US government bond yield was 1.51%. On 12 October 2026 it was 5.24%.
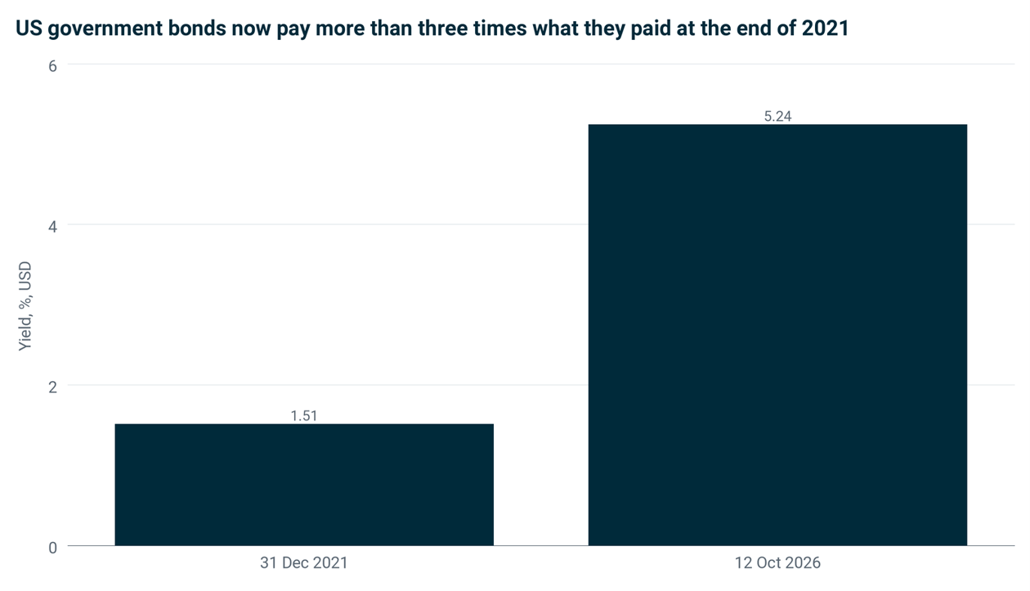
Chart 1. What 10-year US government bonds paid at the end of 2021 and on 12 October 2026. Yields are in US dollars and unaffected by exchange rates.
Source: US Federal Reserve H.15 10-year constant maturity yield (31 Dec 2021, as cited in PortfolioMetrix, Sept 2026); MacroMicro (12 Oct 2026). Yield, %, USD.
That interest does real work when prices fall. In 2022 the US bond market lost about 13% in dollars, because bonds were paying almost nothing when the shock hit. This year, to the end of August, prices fell by about 3%, but the interest received covered most of it and left investors down by less than 1%. We looked at this in more detail in September. Bonds are paying you more to wait than at almost any point in the past 20 years.
"Markets have never been this concentrated" ?
This one is closer to true than the others. The 10 largest US companies make up close to 40% of the US market, according to Capital Group. In 1964 the figure reached 39%, when the leaders included AT&T, General Motors and IBM. Across the developed world, the 10 largest companies were 27.9% of the global index at the end of September.
Concentration is also how stock markets have created wealth. Hendrik Bessembinder of Arizona State University studied nearly 30,000 US shares over the century from 1926 to 2016. Long-term investors in nearly 60% of them lost wealth. Just 46 companies accounted for half of the $91 trillion that shareholders gained. An index weighted by company size holds those winners as they grow and lets the fading names shrink, without having to know in advance which is which.
Does a concentrated market carry more risk? Mark Kritzman of MIT and David Turkington of State Street tested this in the Financial Analysts Journal this year. They built a strategy that held less in shares when the US market was concentrated and more when it was spread out, then compared it with holding the same average amount throughout. From 1936 to 2025, the buy-and-hold strategy earned 5.6% a year above cash with volatility of 10.7%. The concentration-timing strategy earned 4.7% with volatility of 12.1%. Holding steady built more than twice the wealth, with less risk.
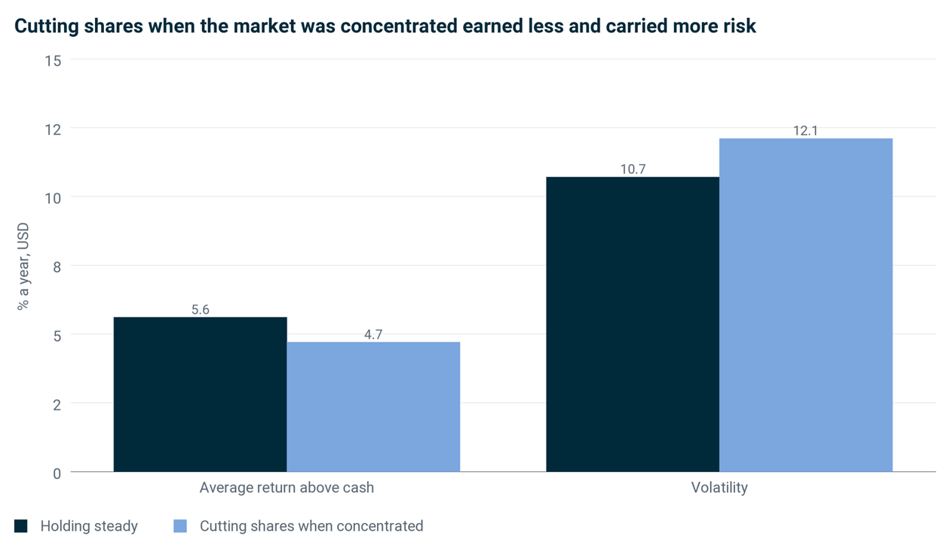
Chart 2. Chart 2. Average yearly return above cash and volatility, holding steady against cutting shares when the US market was concentrated, 1936 to 2025. US dollars.
Source: Kritzman and Turkington, The Fallacy of Concentration, Financial Analysts Journal 82(2), 2026, Figure 4. US stock market, Jan 1936 to Jun 2025, USD. Past performance is not a reliable indicator of future results.
The authors ran the same test on five other major stock markets from 1983. Cutting back hurt in three of them and made no meaningful difference in the other two.
The popular cures carry risks of their own. Weighting every company equally deals with the few big names and swaps them for something else. In the global index, technology companies are 31.8% of the market. In its equal-weighted version they are 11.4%, and the US falls from 72.9% to 40.6%. That is a large bet against one sector and one country, made without a view on either.
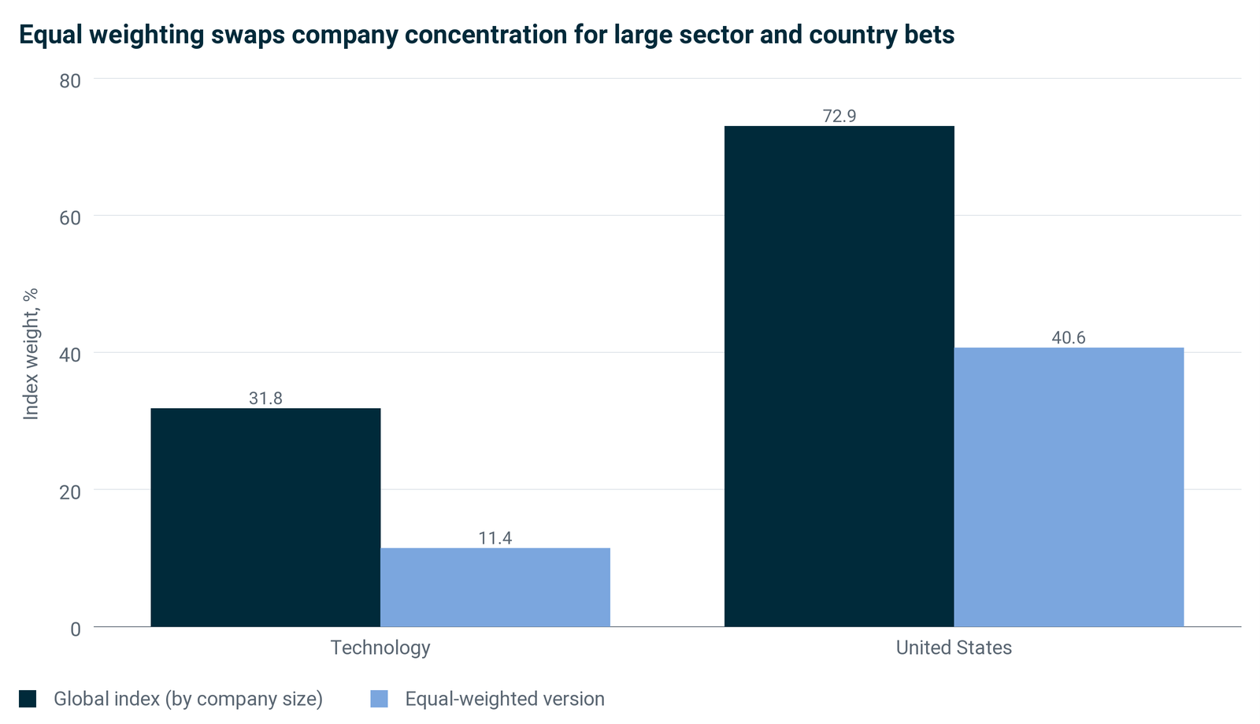 Chart 3. Weights in the global stock market index and its equal-weighted version, 30 September 2026. Index weights, based on US dollar values.
Source: MSCI World Index and MSCI World Equal Weighted Index factsheets, 30 Sep 2026. Weight, %, USD basis.
Risk is never destroyed, only transformed. Stepping away from the market's giants moves your risk somewhere else, and that move deserves the same scrutiny as any other active decision. Concentration in and of itself is not a reliable timing tool.
"Diversification doesn't work anymore"
For investors who spread their money widely, the past decade has tested patience. In US dollars, the global stock market index returned 13.4% a year over the 10 years to September 2026. Emerging markets returned about 9.5%, and so did an equal-weighted version of the global market, which leans towards smaller companies. Much of what sat outside the largest US companies lagged.
Unrewarded for a decade, but still working as designed. Diversification exists so that your outcome doesn't depend on knowing which part of the market will lead. It will trail the winner of the moment because it spreads its bets, and the same spread keeps you away from the full weight of the losers.
Leadership has changed more often than a 10-year average suggests. Emerging markets beat the developed world in four of the past 10 calendar years, including 2025, when they returned 34.4% against 21.6%, both in dollars.
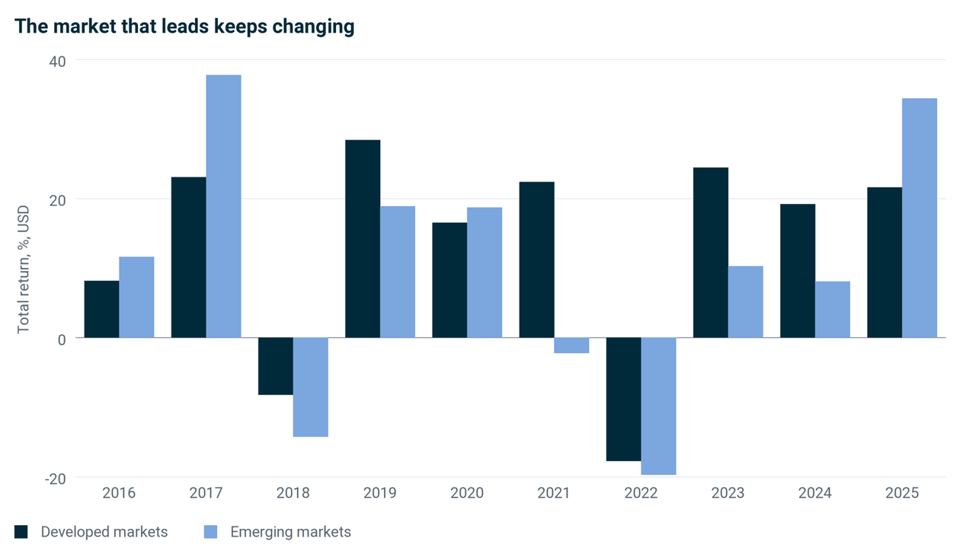 Chart 4. Yearly total returns from developed and emerging stock markets, 2016 to 2025. US dollars.
Source: MSCI World and MSCI Emerging Markets Index factsheet, 30 Sep 2026. Gross total returns, %, USD. Past performance is not a reliable indicator of future results.
The cure on offer is usually more concentration, in themed funds or high-conviction managers. Each is a decision to step away from the market, and each has to earn its place after costs.
What this means for you
Each of these myths takes something real and turns it into a reason to act. Bonds did fall with shares. The market is concentrated. Diversification has been a frustrating thing to own. On the evidence, none of those observations is a reason to rebuild a plan that was designed with them in mind.
A well-built portfolio holds bonds for the day growth falters, and today those bonds pay you more to wait. It holds the market's giants in proportion, so it doesn't need to guess which ones keep growing. And it spreads across regions and company sizes so that no single story decides your outcome. Any step away from that starting point is an active decision, made deliberately and with a reason that would survive being wrong.
Narrative sells. Portfolio engineering protects. Your plan was built for your goals before this year's headlines were written, and it is better placed than those headlines suggest.
Important information
This document is only for professional financial advisers. The information given here is for information purposes only and is not intended to constitute financial, legal, tax, investment or other professional advice. It should not be relied upon as such and PortfolioMetrix cannot accept any liability for loss for doing so. Any forecasts expected future returns or expected future volatilities are not guaranteed and should not be relied upon. The value of investments, and the income from them, can go down as well as up, and you may not recover the amount of your original investment. Past performance is not a reliable indicator of future performance. Portfolio holdings and asset allocation can change at any time without notice.
PortfolioMetrix Asset Management Ltd is authorised and regulated by the Financial Conduct Authority. Full calculation methodology available on request.
Interest rates on bonds are not guaranteed and will change. Bond prices and interest rates move in opposite directions, so a rise in interest rates is likely to reduce the capital value of bonds. Currency: the split between price change and interest received for the US bond market, and the 2022 comparison, are US-sourced and shown in US dollars; the pattern is not specific to any one market but the figures are. The returns by type of bond are also shown in US dollars, using funds that are either denominated in US dollars or hedged to US dollars, with one unhedged exception identified in the accompanying data file. The correlation figures are measured in each index’s own local currency, the European indices in euros and the US indices in US dollars. Bond yields quoted in this document are stated in the currency of the bond concerned and are not affected by exchange rates. Returns are: for an investor whose own currency is sterling or rand, exchange rate movements will add to or subtract from the returns shown unless the holding is currency-hedged. The figures in Chart 4 describe historical relationships and are not a forecast. All market data as at 1 to 3 September 2026 unless otherwise stated, sourced as cited: BNN Bloomberg, World Economic Forum, YCharts, ChartRow, iShares, State Street Global Advisors, Trading Economics, Bloomberg, Janus Henderson and AQR.